Service Monitor
Know the moment your site, API or nightly job stops working.
Service Monitor checks your websites and APIs on a schedule, and listens for heartbeats from the jobs and integrations that should run on time. When something fails, you get one alert when the problem is confirmed and one when it recovers.
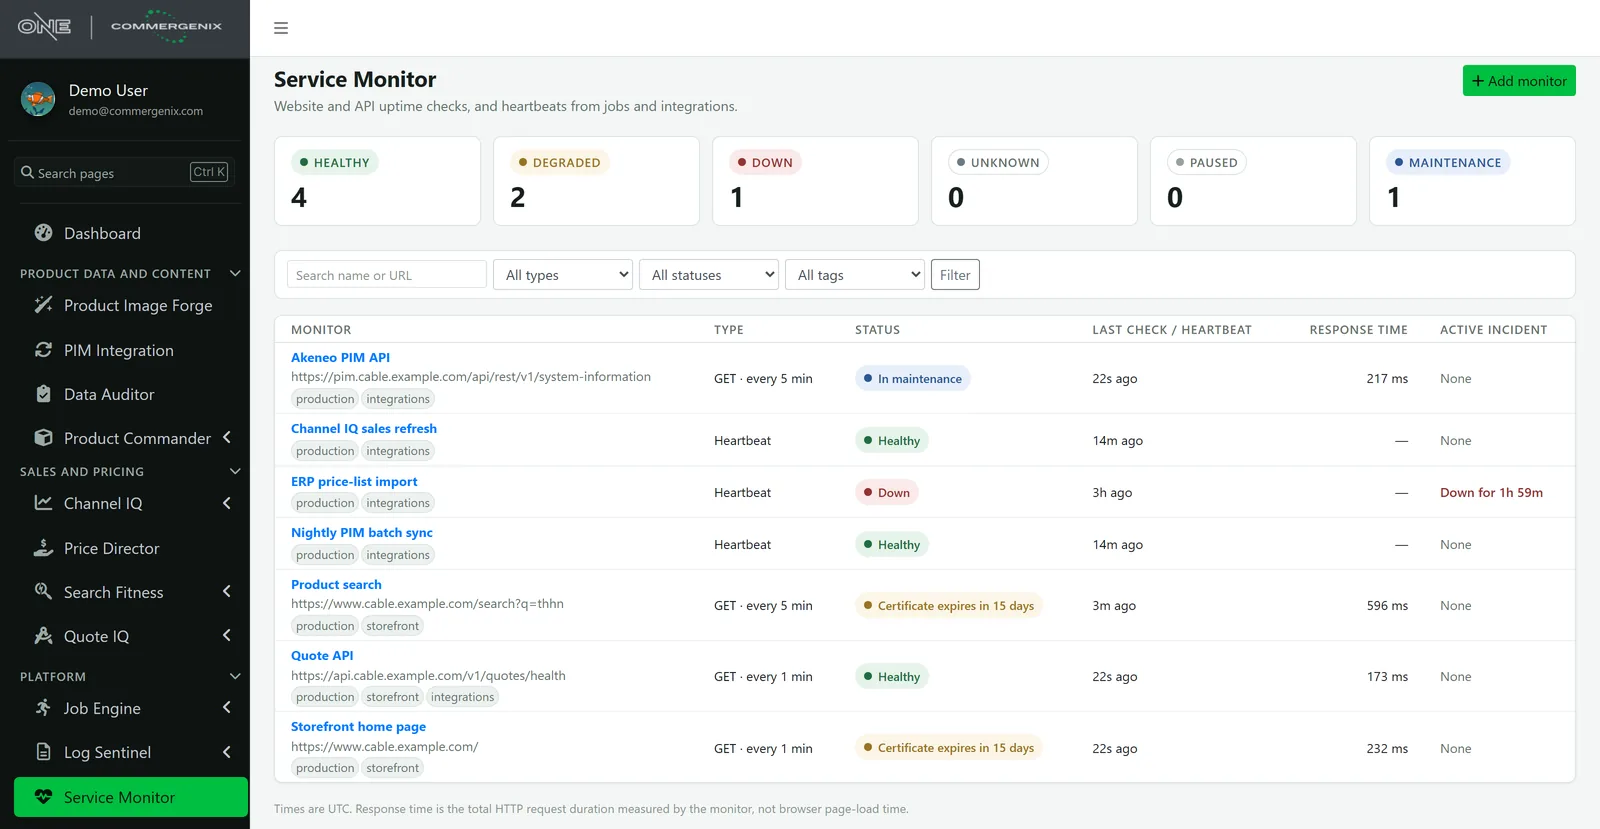
Not just up. Answering the way it should.
Each monitor checks for the answer you expect, and reports exactly how a check fell short.
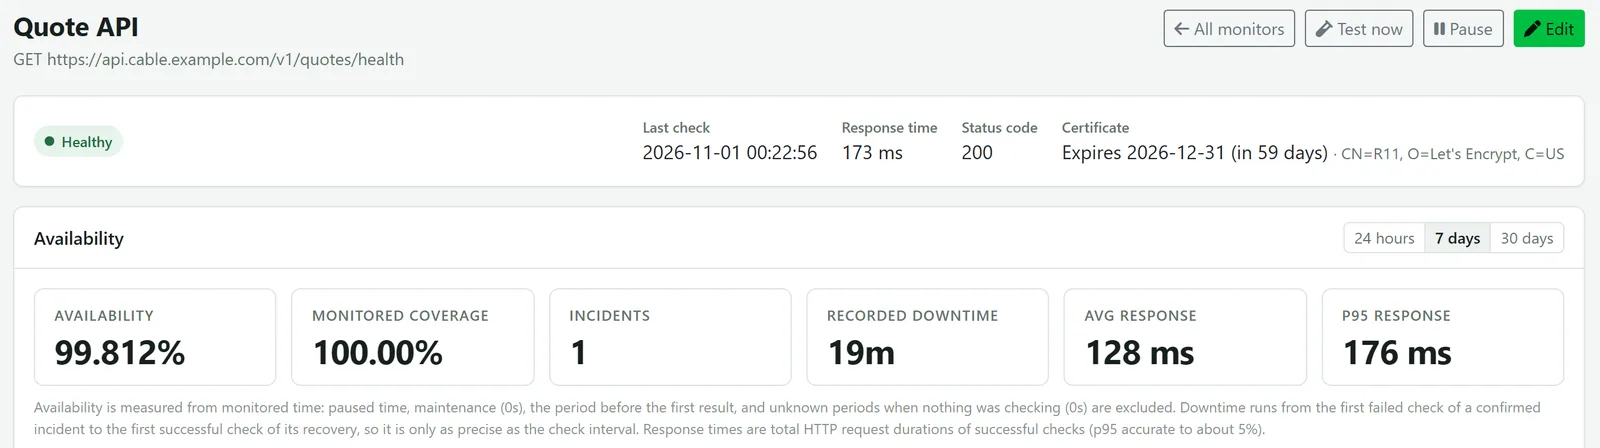
Quote API
GET https://api.cable.example.com/v1/quotes/health
every 1 minute
expect: HTTP 200–299, JSON status = ok
- Oct 29, 19:12 UTC
- HTTP 503: “pricing service restarting”
- Recovered
- 19:31 UTC, after 19 minutes
- Last 7 days
- 99.812% available · 128 ms average
- Certificate
- Expires 2026-12-31 (in 59 days)
One alert when the failure was confirmed, and another when it recovered.
“Is it up?” is the wrong question.
-
Up isn’t working
A page can load in 30 ms and still be the wrong page, an error, or an empty cart.
-
Silent jobs
A nightly import that never started doesn’t throw an error. It just leaves yesterday’s data in place.
-
Alert storms
Checks every minute can mean sixty alerts an hour for one outage, until people stop reading them.
Two ways to watch, one way to be told.
-
Websites and APIs
Request a URL on a schedule and check the status, the text on the page or a value in the JSON.
-
Heartbeats
A job or integration reports in each time it runs. Missing the window counts as a failure.
-
No false alarms
Choose how many failures confirm a problem and how many successes confirm recovery.
-
Once, where you work
In Commergenix, Teams or browser push, email, or a signed webhook: once when it breaks, once when it’s fixed.
Availability you can explain.
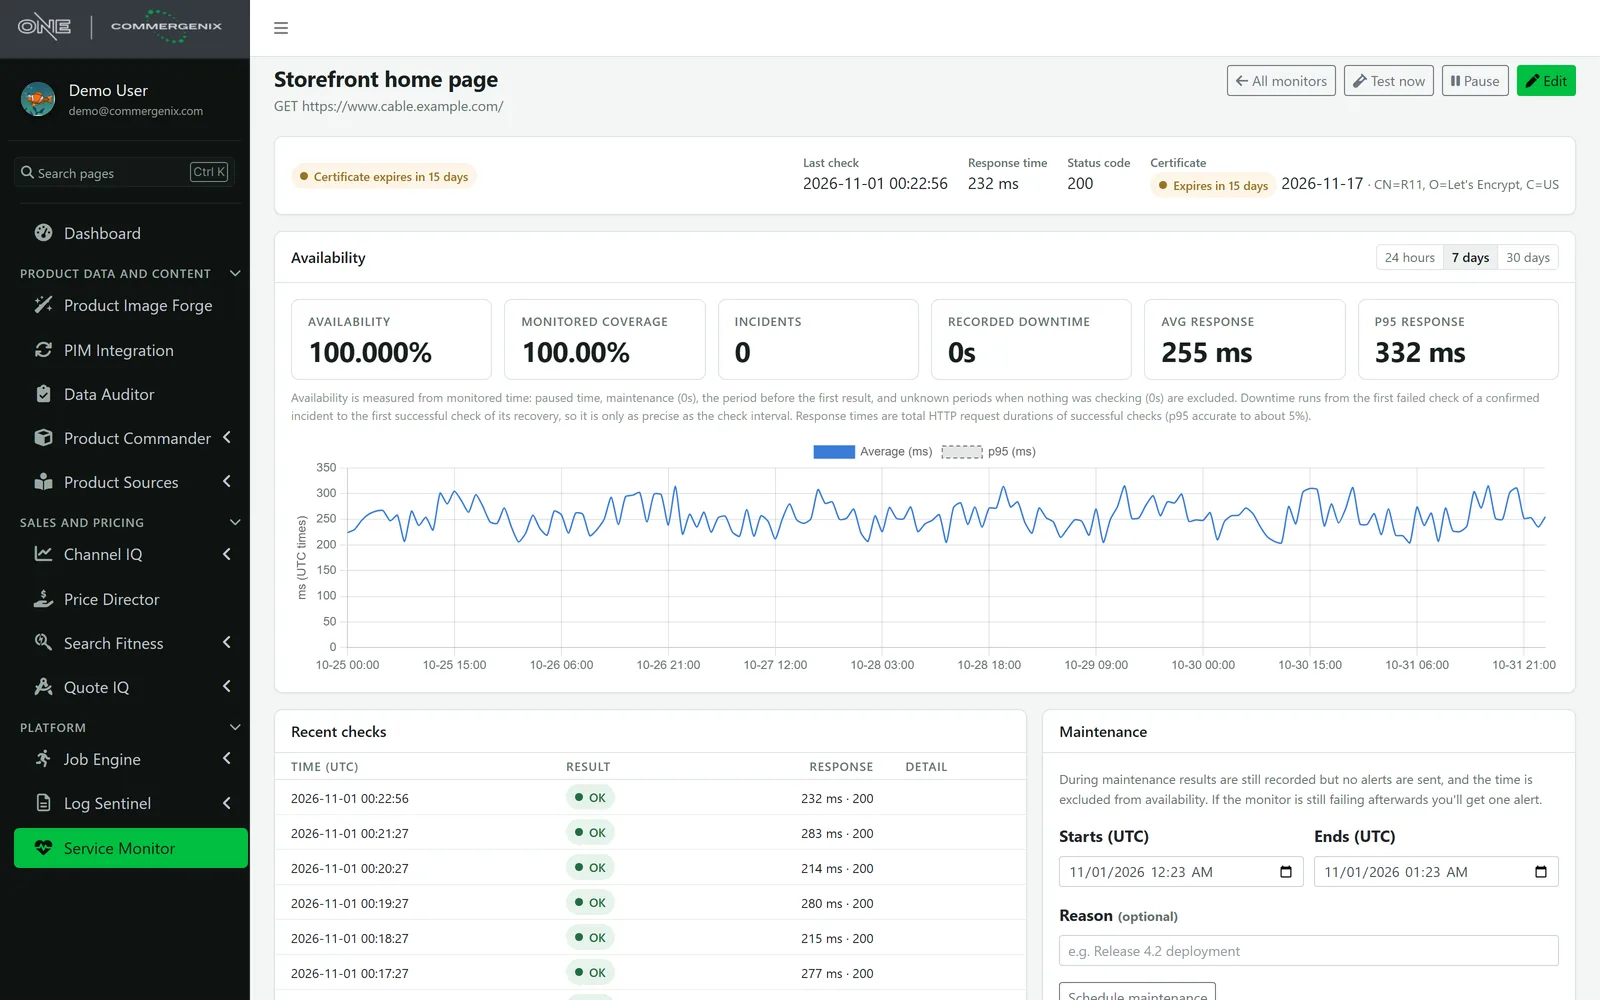
Each monitor shows its current status, response time, status code and certificate, then availability, incidents, recorded downtime and average and p95 response times for the last 24 hours, 7 days or 30 days, with a chart and every recent check.
- Measured honestly: paused time, maintenance and periods when nothing was checking are left out of availability, and the page says so.
- Certificate warnings before your TLS certificate expires.
When it breaks, see exactly how.
A failing monitor says what went wrong in plain words, how long it has been failing, and records the incident with its start, recovery and cause, so availability is something you can explain.
- The reason, verbatim: the status the service returned and the message it gave, such as “HTTP 503: pricing service restarting”.
- Test now runs a check on demand.

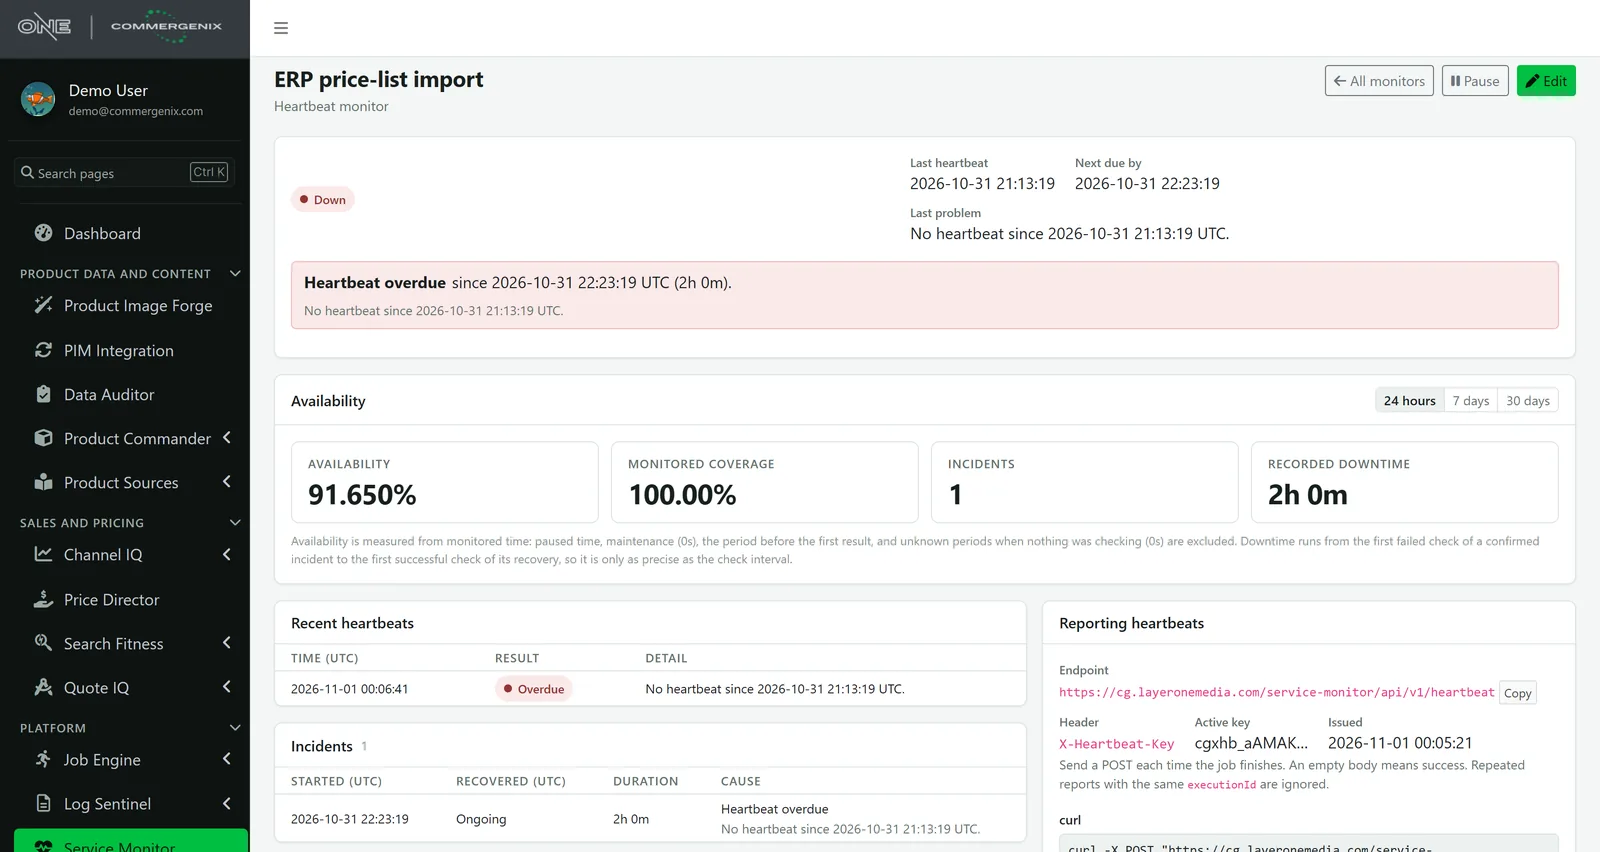
Catch the job that never ran.
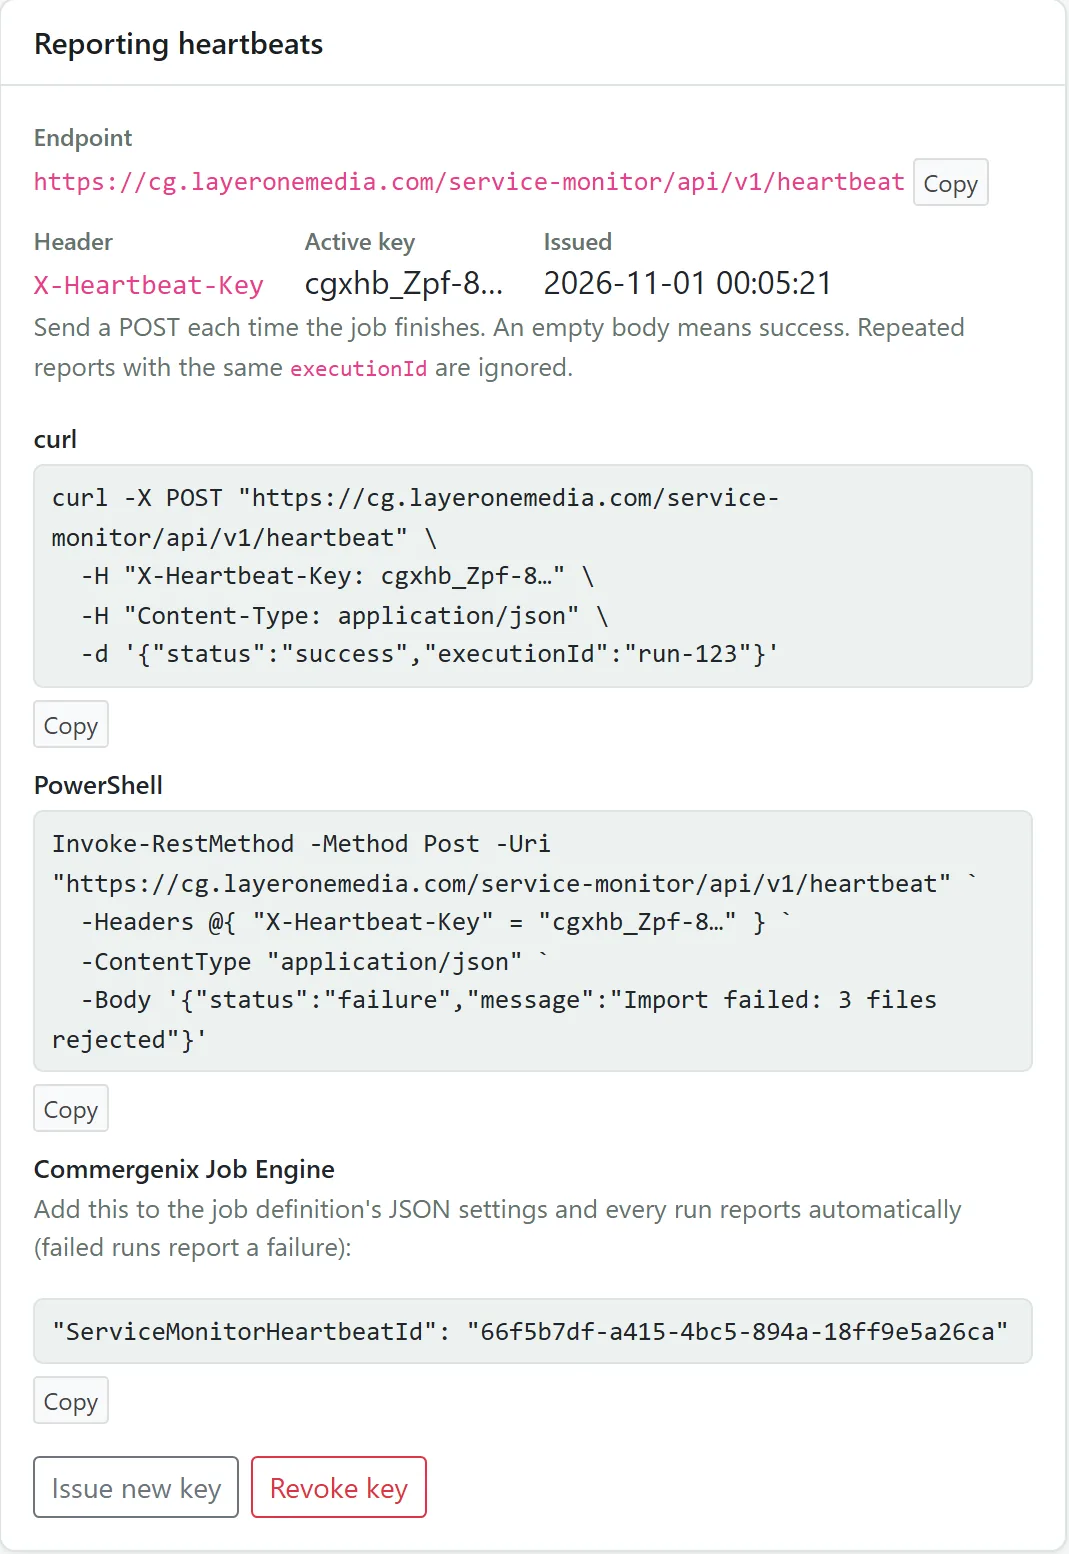
Give a job a heartbeat: how often it should report and how much grace to allow. Each run sends a POST with a key; an empty body means success, or it can report a failure with a message. If the heartbeat is late, the monitor goes down and you’re alerted.
- Works from anything: copy-ready curl and PowerShell examples, and one line connects a Job Engine job.
- Repeats are ignored: reports with the same run ID only count once.
- Keys you control: issue a new key or revoke the old one at any time.
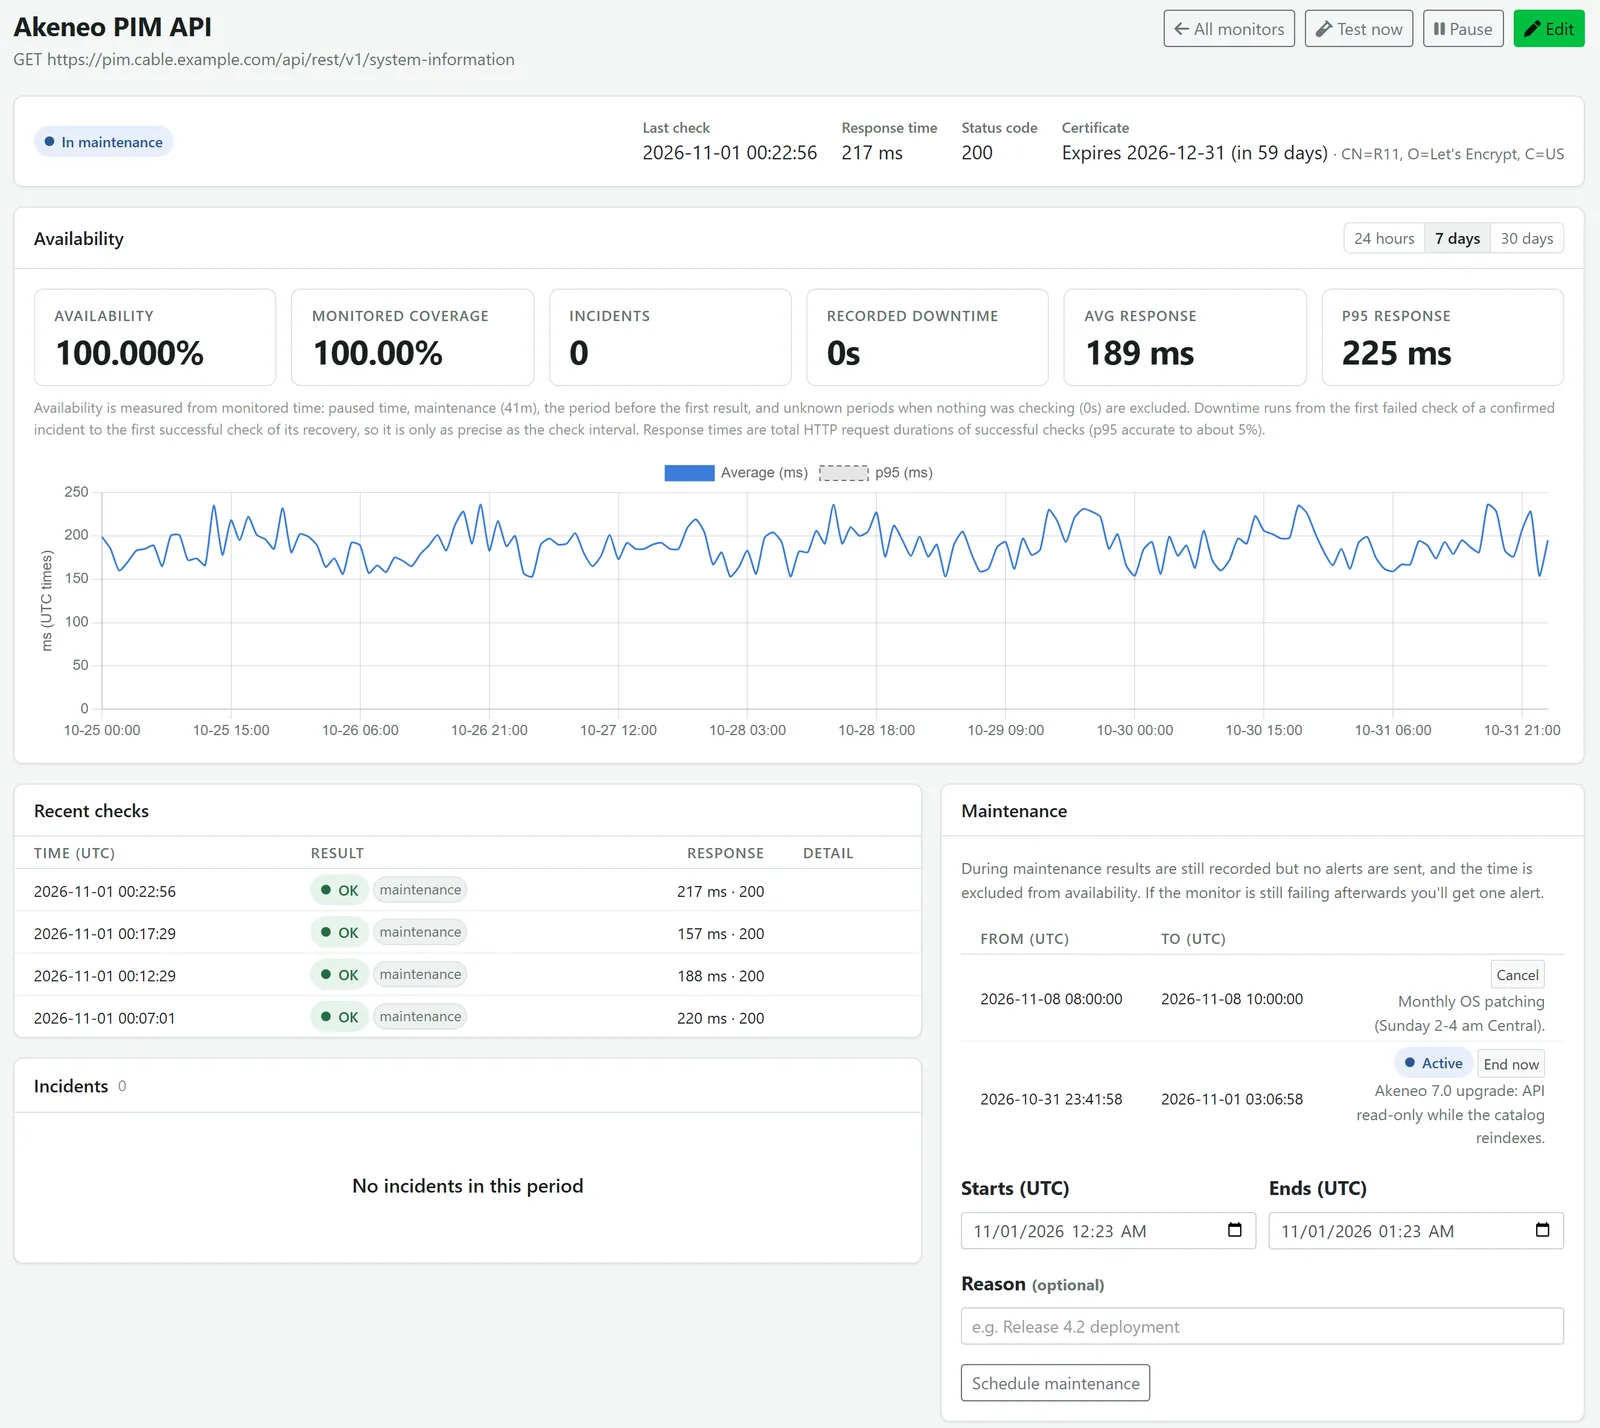
Planned work without false alarms.
Schedule a window, one-off or ahead of time, with a reason. Checks keep running and are recorded, but no alerts go out and the time doesn’t count against availability. If the service is still failing when the window ends, you get one alert.
- End it early when the work finishes, or cancel a window that is no longer needed.
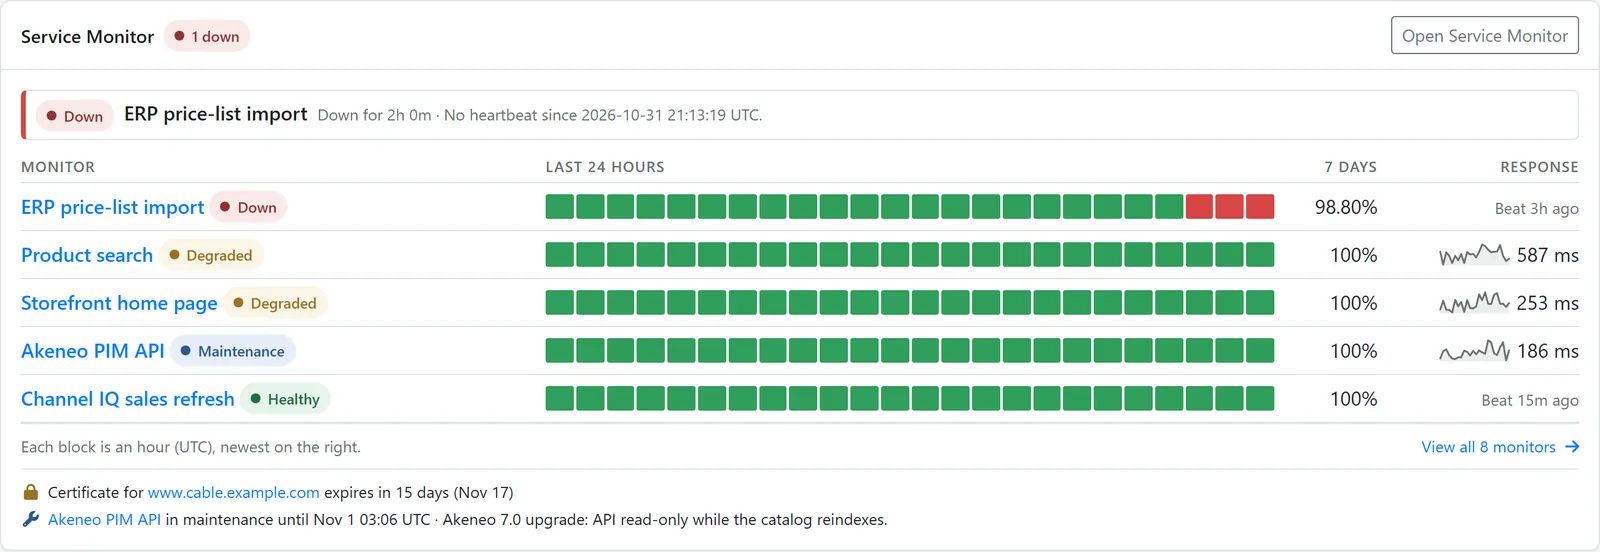
Problems first, the moment you sign in.
The Service Monitor card on the Commergenix dashboard puts anything down at the top, then every monitor with its last 24 hours, its 7-day availability and response time, plus certificate warnings and maintenance in progress.
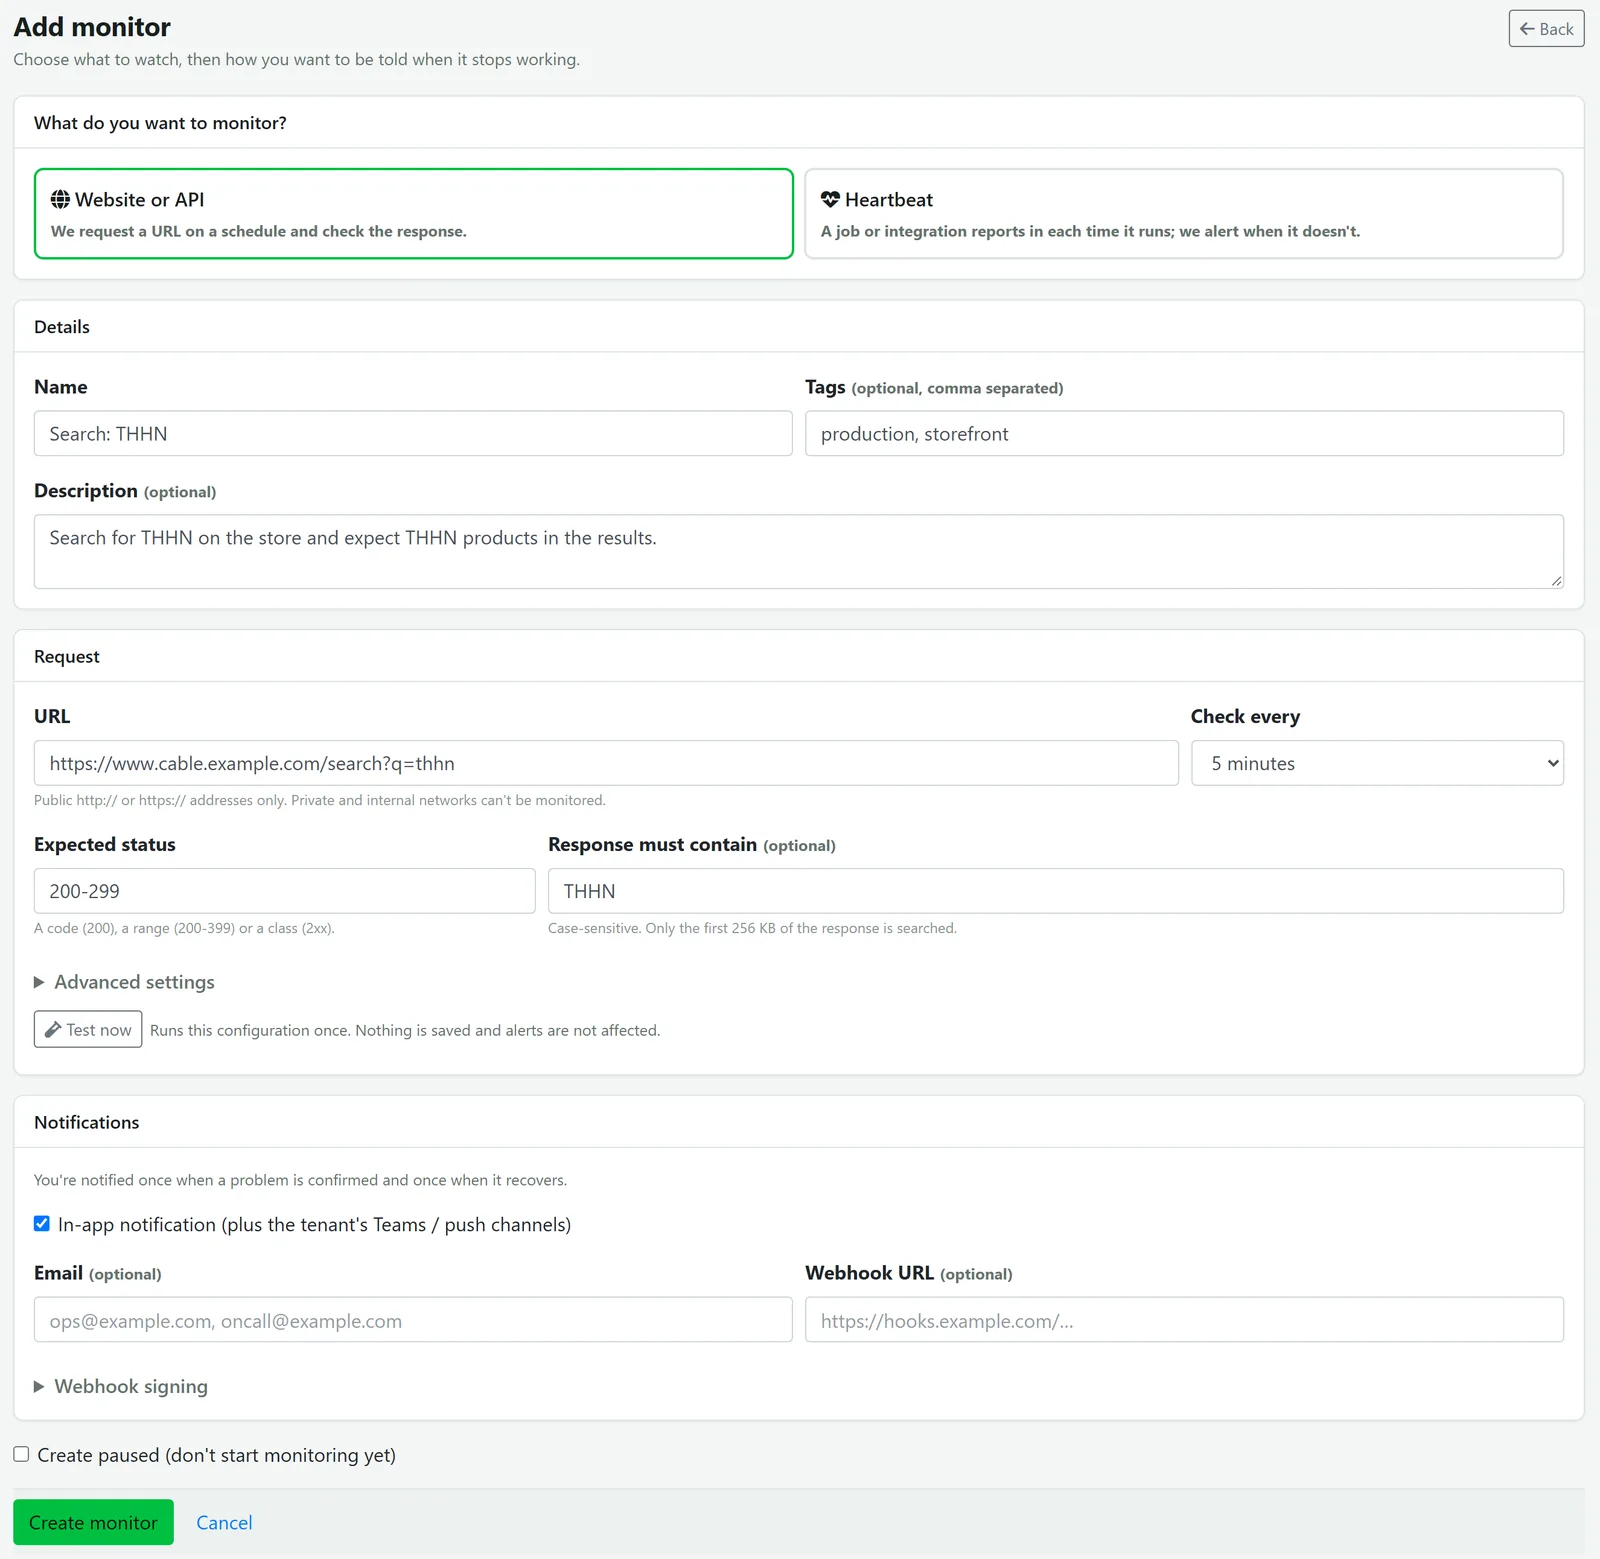
Say what “working” means.
Pick a website or API check, or a heartbeat. For a check, set the URL, how often, the expected status (a code, a range or a class) and text the response must contain. Advanced settings add the method, timeout, a slow threshold, a JSON property that must exist or equal a value, request headers and protected headers such as Authorization.
- Try before you save: Test now runs the configuration once, without saving and without alerts.
- Tags to group monitors, such as production or storefront.
- Notifications per monitor: in-app with your Teams and push channels, email addresses, and a webhook with an optional signing secret.
Alerts people keep reading.
Confirmed, then recovered
You choose how many failures confirm an incident and how many successes close it, and you’re notified once for each.
Public addresses only
Checks go to public http and https addresses; private and internal networks can’t be targeted.
Secrets stay protected
Protected headers and webhook signing secrets are stored encrypted and never shown again once saved. You can replace or remove them at any time.
Numbers that say how they’re measured
Availability, downtime and response times come with a plain note on what’s included and how precise they are.
For teams whose business runs online and overnight.
Ecommerce teams
Watch the storefront, checkout and APIs your customers rely on, and hear about problems first.
Integration owners
Put a heartbeat on every import and sync, so a job that quietly stops is noticed the same day.
IT managers
See availability and incidents for each service, and schedule maintenance without false alarms.
Common questions
What can it check besides “the page loads”?
The status code (exact, range or class), text the response must contain, a JSON property that must exist or equal a value, response time against a slow threshold, and the TLS certificate’s expiry.
How do heartbeats work?
Your job sends a POST to the monitor’s endpoint with its key each time it finishes. If no report arrives within the expected interval plus the grace period, the monitor goes down and you’re alerted.
Will I get an alert every minute during an outage?
No. You’re notified once when a problem is confirmed and once when it recovers.
Can it watch our internal systems?
Website checks only go to public addresses. For internal jobs and systems, use a heartbeat: they report out to Service Monitor instead.
Where do alerts go?
In-app, plus your company’s Teams and browser push channels, any email addresses you list, and a webhook you can sign with a secret.
Works alongside
Every Commergenix module shares one sign-in, one job engine, and one set of integrations, so each one you add makes the others more useful.
Job Engine
Schedules and monitors background work such as syncs, imports, and data refreshes, with run history and alerts.
Learn more →Log Sentinel
Collects and reviews application logs from connected systems such as your online store.
Learn more →Search Fitness
Regular test reports on how well your storefront search performs.
Learn more →Name the five things that must never be down.
We’ll set up checks and heartbeats for them and show you what “working” looks like over a week.